MEFANET Journal 2017; 5(2): 62-68
ORIGINAL ARTICLE
NeuroEDA – an interactive web tool for neuroinformatics data analysis and teaching biomedical statistics
Ondřej Klempíř*, Laura Shala, Jan Tesař, Radim Krupička
Department of Biomedical Informatics, Faculty of Biomedical Engineering, Czech Technical University in Prague, Kladno, Czech Republic
* Corresponding author: ondrej.klempir@fbmi.cvut.cz
Abstract
Article history:
Received 24 July 2017
Revised 18 August 2017
Accepted 6 September 2017
Available online 12 September 2017
Peer review:
Daniel Schwarz, Martin Komenda
Download PDF
Background: Neuroinformatics is a rapidly developing interdisciplinary field which provides an enormous amount of data to be classified, evaluated and interpreted. Usage of exploratory data analysis (EDA) methods is essential in evaluating clinical data in medicine and this analysis remains a big challenge because each new system has specific requirements. Visualizations, models and illustrations of dependency can help in better understanding of measurements in diagnostics and in decision making. The number of available modern EDA packages for developers is increasing as well as the development in the Data Science field. The development of modern methods of data analysis must also be incorporated in university education.
Objective: The aim of the study is to design and develop software, which implements current EDA packages and model making procedures for neurological data analyses which could be easily modified. The second objective is to evaluate the possibility of supporting the education of biomedical engineering students at the undergraduate level in order to provide effective support in biomedical data analysis.
Methods: An application has been created under the reactive Shiny framework in the R language. Data in .csv or .tsv format are processed on the server side of the application.
Results: We have developed a new easy-to-use software named NeuroEDA for interactive web-based biomedical data assessment. This application covers basic descriptive statistics, exploratory graphs and cluster analysis, which is also suitable for big data examination. Furthermore, this application offers methods for robust and non-parametric analysis. These are particularly useful in neuroinformatics from our long-term experience. The application was practically deployed in the evaluation of clinical neurological data and in teaching the subject Biomedical Statistics.
Conclusion: We have introduced the possibility of creating biomedical software for clinical use and demonstration in teaching. Among the advantages of the application, is that it is easily expandability with new R packages and quick processing in web browsers. The interactive user interface allows one to work with R’s functions without needing scripting/programming knowledge. Students can acquire practical experience in processing and transformation of heterogeneous medical data not only in biomedical engineering fields, but also at the medical faculties for Medical Informatics. This application is actively used for neuroinformatics data assessment and in discovering some potentially useable hypotheses.
Keywords
Software; statistics; neurology; medical informatics; teaching
Introduction
Exploratory data analysis (EDA) has been systematically studied from the age of statistician John W. Tukey. In his book (1977), EDA was defined as a statistical method for finding interesting hypotheses and relations in data [1]. It was mainly about the graphical techniques of data representation: boxplots, histograms, scatter plots or manually calculated analysis of principal components etc. Deep analysis of data integrity and the variance of values, correlations and i.e. groups of discrimination in data, plays a key role in pre-processing and the subsequent creation of descriptive and predictive models. EDA is even more important in medicine, typically for small dataset counts or due to outlier observations.
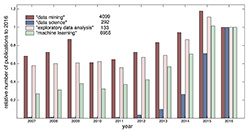
Research and the application of EDA methods are constantly progressing and this progress reflects the rapid rise of the importance of areas related to computational data analysis and data science in general (Figure 1). The number of scientific papers from all data science fields grows every year in the Web of Science (WoS). Recent medical examples of EDA progress are, for instance, in application for electronic medical records [2], text mining in obstetrics [3] or methodology in neurosciences [4].
Despite the mathematical nature and recommended methods, modern EDA is a form of art and an expression of the author/analyst's creativity [5]. Creativity and the authors knowledge in the form of various packages, tools and libraries can easily be integrated into the work of biomedical software programmers. The creation of a precise, and compendious graph is in many cases more efficient than inductive analysis based on p-values. Current statistical studies point to an excessive or automated problem of statistical significance usage by p-values in medicine and psychology [6-9]. Visual analysis (visual mining) seems to be an appropriate alternative to inductive statistics [10].
Figure 1. Annual progress of the count of key phrases in scientific papers in the Web of Science related to the Analysis and Data Processing field for the last 10 years (to the year 2016) (own arrangement according to WoS)
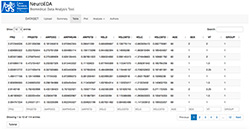
Figure 2. View on NeuroEDA application environment with imported data and table visualization
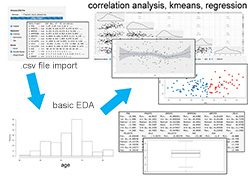
Figure 3. NeuroEDA Process map / Workflow
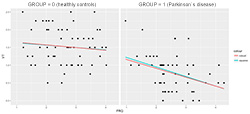
Figure 4. Example of visually discovered clinical hypothesis by NeuroEDA: the FRQ parameter has a greater impact on expert assessment in the patients group
This article introduces an interactive web application NeuroEDA, which implements current EDA packages and model making procedures for neurological data analyses (i.e. near infrared spectroscopy data (NIRS), transcranial magnetic stimulation data (TMS), camera systems or microelectrode recordings (MER)) in the form of a BioData product. The data product is the production of output from statistical analysis, which automates complex analysis tasks or uses technology to expand the utility of a data informed model, algorithm or inference. The study includes data from the Department of Biomedical Informatics, Faculty of Biomedical Engineering, Czech Technical University in Prague (DBI FBME CTU), which in the long-term cooperates with the Department of Neurology and Centre of Clinical Neuroscience, First Faculty of Medicine, Charles University in Prague.
Methods
The application was developed because of the need for an integrating interface with new statistical methods for biomedical data analysis at DBI FBME CTU. It was programmed using the open source programming language R, which is a significant member in the statistical computing field. The app kernel is based on Shiny framework, standing on the reactive programming paradigm [11, 12]. Reactive programming was designed, above all, to simplify interactive user interface creations. The Shiny application is composed of two main parts, the user (ui.R) in the form of a webpage, and the server part (server.R). Within Shiny, reactivity is provided by reactive inputs and outputs. Typical input is the user’s demand with a web interface. For example, picking one of several form choices, filling out the text field or clicking on a button. These actions set parameters, with which the application immediately reacts by rendering an output (graph display, table operation etc.). It can be executed on a local server and used within a web browser. The user controls the application within the user interface, and sends requests to the server, where computations are made and outputs are updated.
This application allows the user to import data in the .csv format. A file is chosen in the file system. It is possible to change a delimiter (comma/semicolon/tab) and turn the header on or off. Basic information is reactively displayed after uploading the dataset. The user can see basic attribute summaries or view datasets as a table, with paginating, sorting, filtering and searching options (Figure 2).
Results
The program is composed of five functional units: Upload, Summary, Table, Plotting and Analysis. It operates in graphical user interfaces (GUI).
Several methods were implemented for dataset exploratory analysis:
- graph visualizations, using the “ggplot2” package: e.g. boxplot, histogram, scatter plot,
- interactive correlation analysis + kernel density estimation using the “Ggally” package,
- k-means algorithm for finding compact clusters in data,
- imple regression analysis with an independent and dependent variable using least squares method,
- locally weighted regression (LOESS) using the “ggplot2” package – able to find nonlinear trends, suitable for detection of rapid dropdowns or other interventions,
- robust regression using the “robust” package – lower sensibility to outliers, represents linear models with smaller counts of observations better than the least squares regression method,
- the mclust - package provides models and methods to estimate the number of clusters in the multivariate dataset. The algorithm uses 10 models to calculate default 1 to 10 Gaussian Mixture Model (GMM) components (clusters) and Bayesian Information Criterion (BIC) to select final number of clusters.
The most beneficial clinical property of the NeuroEDA is the mclust package, which is practically used in our neuroinformatics research to automatically determine the number of clusters in the 2D data and for the subsequent classification, including the quantification of the uncertainty of the decision algorithm. In short, the number of detected clusters represent the number of neurons in the MER. Routine education of the whole analytical process enables evaluation of the data by bachelor students.
Case 1: clinical neurology dataset
The application was tested on several publicly accessible datasets of various extent (i.e. iris, mtcars of “datasets” package). Moreover, it was used for clinical neurological dataset exploratory data analysis of camera system measurements. Records represent parameters of periodic hand movements, or finger tapping (FT). FT stands for repetitive touching of a thumb and a forefinger following maximal expansion, as fast as possible. Measurements were taken in healthy controls (N = 59) and Parkinson disease patients (N = 55). An overview of the selected features is shown in the table (Table 1).
Table 1. Title and description of selected features from finger tapping measurements
|
Title |
Description |
|
GROUP |
group membership: = 1 (disease) |
|
SEX |
sex: = 1 (female) |
|
VT |
expert rating (numeric) |
|
FRQ |
mean tapping frequency [Hz] |
|
FRQSTD |
FRQ standard deviation (std) [Hz] |
|
AMPDEC |
amplitude decrease of fingers distance [cm] |
|
AMPMEAN |
mean amplitude of fingers distance [cm] |
|
AMPSTD |
std amplitude of fingers distance [cm] |
|
VELO |
finger opening velocity [m/s] |
Ways of working with the neurological dataset in NeuroEDA application are depicted in the process map (Figure 3). It is clearly visible, that based on FRQ and VELO parameters, it is possible to automatically distinguish between patients and healthy subjects, using k-means algorithm (two groups with an unsupervised separation).
The example of a visually found hypothesis by linear and robust regression methods has a practical importance. It was discovered that there is a difference between healthy vs. patient’s groups considering this regression model (Figure 4):
dependent variable (y): VT
independent variable (x): FRQ
The tapping frequency parameter (FRQ) on how an expert evaluates a patient's condition has a significantly greater impact in the group of patients. Moreover, an expert is much more focused on finger tapping frequency than in a healthy group (in which case the expert is most likely considering some other parameter).
Case 2: Biomedical Statistics course
The Biomedical Statistics lectures at the FBME CTU include a demonstration of the basic algorithms and methods for medical decision making (e.g. statistical inference, cluster analysis and regression). For better understanding, practical lessons should consist of exercises using this NeuroEDA application. Practical work with this system helps students to understand the Fundamentals of Statistics in medicine. Local versions of NeuroEDA were installed in the Laboratory of Information Technology in Biomedicine, which is supervised by the DBI FBME CTU. A pilot of 33 students in the 1st and 3rd year of a bachelor's degree in Biomedical informatics and Biomedical Technician were enrolled in the course. The faculty Moodle system materials are used for testing their learned skills.
Main scenario – the creation of a biomedical data analysis processing pipeline starting from loading of heterogeneous data files, to the interpretation of the achieved results. Within the main scenarios various tasks have been proposed depending on the complexity: e.g. management of dataset and preparation for inferential statistics, basic EDA, selection of optimal number of clusters by k-means, usage of robust regression in small sample etc. Each app functional unit included a bookmark with a brief, illustrative tutorial of use.
In a broader context, the exercises focus on the statistical fundamentals of preparing a simple BioData product that can be used to tell a story about data to a mass audience.
Discussion and conclusion
NeuroEDA application is an easy to use software developed by biomedical engineers. Its outstanding feature, which makes it different from all existing statistical software, is its quick extendibility with new available statistical R packages on demand. The application provides immediate response, even in cases with bigger data files. Functionality was also successfully tested in commonly used web browsers (Google Chrome, Safari, Mozilla Firefox, Internet Explorer). The main advantage of the application is the availability of robust regression and the mclust package, that are not usually contained in available commercial statistical programmes and are crucial for statistical evaluation of our biomedical data. The usage of the interactive interface allows for working with R functions without any scripting knowledge, therefore it offers usage by non-technical clinic staff.
Future work and intensions
The application is still in an alpha version and is continuously tested and extended with new functions. We are considering direct connection to the database which stores data from various neurophysiological examinations, which is likewise developed at DBI FBME CTU.
An example of one of the already deployed clinical services is REDCap MRIviewer [13]. The MRIViewer can display MRI images that are stored on a SSH-accessible data storage on REDCap [14]. Due to the file sizes and complexity of the project, images must be stored in a large data warehouse which allows for easy viewing and downloading by researchers and physicians. The images are stored on the CESNET network storage and are displayed in a web environment using the modified DICOM Web Viewer. It offers the analytical potential of NeuroEDA (not only EDA, but e.g. image registration and pattern recognition) using packages for highdimensional data - such as MRI or fMRI, directly in DICOM or NIfTI format. In our opinion, the desktop version of Shiny NeuroEDA is capable of absorbing the high dimensional data and to analysing it efficiently. We anticipate problems with uploading from outside the internal system through the online Shiny UI, mainly due to the size of the uploaded files. To our best knowledge, the processing of biomedical images in the Shiny framework is currently unique and its integration into Shiny is possible [15, 16], but slow depending on the system.
Besides table data analysis modules, we also work on the module for analysing time series, according to new measured signals and hypotheses specified by medical doctors. An extended version can be used advantageously in teaching other subjects, namely Time Series Analysis. The application can be deployed in our internal server, and made accessible by a web browser. This allows the user to work with the responsive application not only in the computer lab, but also on tablets or mobile devices without the necessity of installing it on to the local station and can also operate remotely outside of the laboratory in the case of permitted security policies. A substantial amount of the content of this paper has been orally presented in Czech at the MEDSOFT 2017 Conference in Roztoky, Czech Republic. Based on conference discussion and positive feedback, we plan to provide the application for teaching at another biomedical department in the Czech Republic.
Conclusions
In this work, we have introduced the possibility of creating biomedical software for clinical use and demonstration in teaching. A web application, which implements various methods for exploratory data analysis was created. The benefits of using this practical demonstration tools for teaching health professionals were previously shown and not only within the MEFANET. Advantageously, it can be used in the classroom not only in biomedical engineering fields, but also at the medical faculties for Medical Informatics. Students will acquire practical experience in the processing and transformation of heterogeneous medical data. NeuroEDA can be executed without the need of programming knowledge. The application is actively used for neurological data assessment and discovering of potentially useable hypotheses.
Acknowledgements
This study is a result of activities performed within projects AZV Grant no. 16-28119a "Analysis of movement disorders for the study of extrapyramidal diseases mechanism using motion capture camera systems" and SGS17/114/OHK4/1T/17 "Processing and analysis of heterogeneous neuroinformatics data", Grant Agency of the Czech Technical University in Prague.
Availability and implementation
NeuroEDA Shiny app is available at https://neuroeda.shinyapps.io/neuroeda/ and released under the MIT License <https://www.r-project.org/Licenses/MIT>. Source codes are available on request.
References
1. Tukey J. Exploratory data analysis. Reading, Mass.: Addison-Wesley Pub. Co.: Boston 1977. ISBN 978-0201076165.
2. Huang Ch, Lu R, Iqbal U. A richly interactive exploratory data analysis and visualization tool using electronic medical records. BMC Med Inform Decis Mak 2015; 15(1): 92.
3. Tagawa M, Matsuda Y, Manaka T, Kobayashi M, Ohwada M, Matsubara S. Exploratory analysis of textual data from the Mother and Child Handbook using a text mining method (II): Monthly changes in the words recorded by mothers. J Obstet Gynaecol Res 2017; 43(1): 100-105.
4. Mori E, Ikeda M, Nakai K, Miyagishi H, Nakagawa M, Kosaka K. Increased plasma donepezil concentration improves cognitive function in patients with dementia with Lewy bodies: An exploratory pharmacokinetic/pharmacodynamic analysis in a phase 3 randomized controlled trial. J Neurol Sci 2016. 366: 184-190.
5. Peng R. The Art of Data Science. Leanpub: San Francisco 2016. ISBN 978-1-365-06146-2.
6. Any Forward Progress on p-Values? [Online]. Available at WWW: <https://www.r-bloggers.com/any-forward-progress-on-p-values/>.
7. Vidgen B, YAsseri T. P-Values: Misunderstood and Misused. Front Phys 2016, 4: 6.
8. The problem with p-values. [Online]. Available at WWW: <https://aeon.co/essays/it-s-time-for-science-to-abandon-the-term-statistically-significant>.
9. Experts issue warning on problems with P values. [Online]. Available at WWW: <https://www.sciencenews.org/blog/context/experts-issue-warning-problems-p-values>.
10. Wu Ch, Weng Y, Jiang Q, Guo W, Wang C. Applied research on visual mining technology in medical data. In: 2016 4th International Conference on Cloud Computing and Intelligence Systems (CCIS). IEEE: Beijing 2016: 229-233. ISBN 978-1-5090-1256-5.
11. Grolemund G. The Shiny Cheat Sheet. [Online]. Available at WWW: <http://shiny.rstudio.com/articles/cheatsheet.html>
12. Shiny - Reactivity paradigma. Shiny - R Studio. [Online]. Available at WWW: <http://shiny.rstudio.com/articles/reactivity-overview.html>.
13. REDCap MRIviewer. Department of Biomedical Informatics: Faculty of Biomedical Engineering [Online]. Kladno, 2016. Available at WWW: <https://kbi.fbmi.cvut.cz/cs/mriviewer>.
14. REDCap Framework Description. Department of Biomedical Informatics: Faculty of Biomedical Engineering [Online]. Kladno, 2016. Available at WWW: <http://kbi.fbmi.cvut.cz/sites/default/files/REDCap%20dokumentace.pdf>.
15. Shiny-DICOM-Manager: Medical Image data analysis, visualization, and filtration app. [online]. Available at WWW: <https://github.com/iali1/Shiny-DICOM-Manager>.
16. Interactively Visualizing DICOM Volumes and Header Data [online]. Available at WWW: <http://www.aridhia.com/blog/interactively-visualising-dicom-volumes-and-header-data/>.
Please cite as:
Klempíř O, Shala L, Tesař J, Krupička R. NeuroEDA – an interactive web tool for neuroinformatics data analysis and teaching biomedical statistics. MEFANET Journal 2017; 5(2): 62-68. Available at WWW: http://mj.mefanet.cz/mj-20170724.
This is an open-access article distributed under the terms of the Creative Commons Attribution-NonCommercial-ShareAlike 3.0 License (http://creativecommons.org/licenses/by-nc-sa/3.0/), which permits unrestricted use, distribution, and reproduction in any medium, provided the original work, first published in the MEFANET Journal, is properly cited. The complete bibliographic information, a link to the original publication on http://www.mj.mefanet.cz/, as well as this copyright and license information must be included.


