MEFANET Journal 2014; 2(2): 71-78
ORIGINAL ARTICLE
The mathematical model of a LUNG simulator
František Šolc1, František Zezulka1, Ivo Veselý1, Jiří Sekora2*, Martin Mézl2, Anton Eschli3, Ivo Provazník2
1 Department of Control and Instrumentation, Brno University of Technology, Brno, Czech Republic
2 Department of Biomedical Engineering, Brno University of Technology, Brno, Czech Republic
3 Fachhochschule Technikum Wien, Austria
* Corresponding author: sekora@feec.vutbr.cz
Abstract
Article history:
Received 3 December 2014
Revised 15 December 2014
Accepted 20 December 2014
Available online 23 December 2014
Peer review:
Milan Blaha, Jaroslav Majerník
Download PDF
The paper discusses the design, modelling, implementation and testing of a specific LUNG simulator,. The described research was performed as a part of the project AlveoPic – Advanced Lung Research for Veterinary Medicine of Particles for Inhalation. The simulator was designed to establish a combined study programme comprising Biomedical Engineering Sciences (FEEC BUT) and Healthcare and Rehabilitation Technology (FH Technikum Wien). The simulator is supposed to be an advanced laboratory equipment which should enhance the standard of the existing research activities within the above-mentioned study programs to the required level. Thus, the proposed paper introduces significant technical equipment for the laboratory education of students at both FH Technikum Wien and the Faculty of Electrical Engineering and Communication, Brno University of Technology. The apparatuses described here will be also used to support cooperative research activities.
In the given context, the authors specify certain technical solutions and parameters related to artificial lungs, present the electrical equipment of the system, and point out the results of the PC-based measurement and control.
Keywords
Lung; mathematical model; computer simulation; respiration
Introduction
The LUNG simulator (LS) presented in this article can operate as an active (controlled by a computer) or passive (standalone) simulator of real lungs. During the simulation of active lungs, the LS can execute standard physiological breathing or one of the five known (and most important) pathological breathing patterns. This is enabled by not only the mechanical and electromechanical parts of the simulator but also an intelligent hierarchical control algorithm realized via C-RIO hardware and the associated LabVIEW development and simulation SW system. LUNG simulator is also designed in teaching within the Master's Double Degree study program.
The electromechanical structure of the LS simulator is shown in Figure 1 [1], which generally indicates the five major components of the device. The first of these elements is a thoracic chamber, a mechanism that simulates (very approximately) the corresponding part of the human and/or porcine body, the thorax. Although the thoracic chamber cannot fully substitute for the construction of the body, it is capable of providing realistic simulation with related physiological conditions and pathological anomalies. The thoracic chamber is connected to a system of bellows and a vacuum pump, namely the second and third components of the simulator.
The bellows system induces pressure differences within the thoracic chamber via the actual movement of the bellows. The compression and extension of the bellows is in direct correlation to the ball-screw in the centre of the bellows. A motor rotates the ball-screw, enabling the bottom of the bellows to move downward or upward. The pressure change within the thoracic chamber causes an inflation and deflation of the utilised lung or lung equivalent.
The speed of the bellows’ expansion or contraction is continuously controlled by the air flow to or from the lung equivalent being compared with the desired behaviour of the respiratory curve.
The vacuum pump creates a constant negative pressure in order to achieve a more realistic anatomical and physiological breathing situation; this constant negative pressure represents the adhesion of the human lung to the thorax through the pleura.
The fourth part of the apparatus consists in the lung itself. For medical research purposes, different bags from various elastic materials can be used (instead of the human or porcine lung) to simulate different anomalies in the tissue surrounding the lung; importantly, such an alternative approach complies with EU regulations concerning experiments on animals.
The fifth component consists of the group of elements including the electronics, or the measurement and control systems which ensure the stability, accuracy and quality of the breathing process control [3].
To the best of our knowledge, the proposed lung construction and the idea of lung modelling and simulation are original; they differ from pure mathematical simulation of the lung tissue function as analysed in Ionescu et al. [4]. Also, the concept presented in this paper differs from systems that do not use a real lung or some equivalent of relevant biological tissues; an example of such approach is introduced in Mesić et al. [5]. Even though certain structures similar to ours were proposed by Tang et al. [6], we can aptly describe our system as substantially more sophisticated.
The following chapters comprise the analysis of the LS system, the identification of principal mathematical relations between elements of the model, and the evaluation of disturbances, leakages or non-linearity; these aspects are then complemented with the specification of the most appropriate mathematical model of the LS. Moreover, theoretical assumptions are compared with real properties of the system.
Mathematical model of the thoracic box
Figure 1. The electromechanical structure of the LUNG simulator [1]
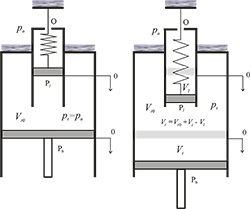
Figure 2. An abstract approximation of the LUNG simulator (LS)
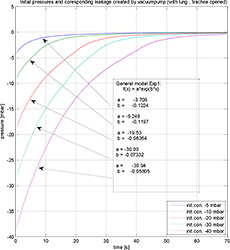
Figure3. The leakage measurement
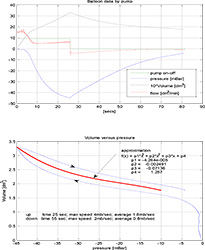
Figure 4. The volume pressure characteristics of the used balloon
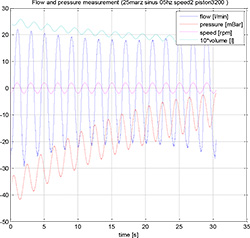
Figure 5. A frequency response to the input Vi
Figure 6. The volume pressure relationship from Figure 5
Figure 7. The detrended signals of the TB pressure and the balloon pressure volumes oscillate around -40 mbar; the negative volume oscillates around 2dm^3
Figure 8. The volume pressure relationship from Figure 6
Figure 9. The frequency phase response approximation
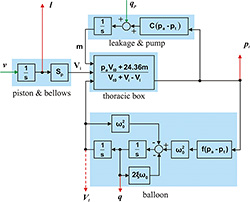
Figure 10. The simulation scheme of the mechanical lung simulator
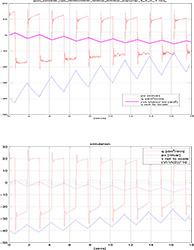
Figure 11. A comparison of the simulation and the real experiment
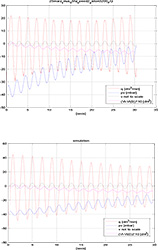
Figure 12. A comparison of the simulation and the real experiment
The real mechanical system was approximated by the abstract system shown in Figure 2. This abstract system consists of a thoracic box (TB) and a lung cylinder, which approximates the balloon of the mechanical model. The volume of the TB is regulated by a piston Pb, which approximates the behaviour of the bellows in the LS, and by the piston Pl of the lung cylinder. The lung cylinder is opened to atmosphere via an opening O. When the piston Pb moves down, the volume Vt of the TB increases, and when the piston Pl moves down, the volume Vl of the lung cylinder increases with the decreasing volume Vt of the TB. Thus, the abstract system works similarly as the LUNG simulator, which reproduces the breathing of a human being.
The abstract system can be described using the mathematic model below. We apply commonly used units instead of SI units where we consider it more appropriate, e.g. dm3 or litres instead of m3.
The volume of the TB is given by the following formula:
 (1)
(1)
where Vt is the volume of the TB [dm3], Vt0 is the initial volume of the TB (when the Pb is in the zero position), Vi is the volume added by the movement of the piston Pb and Vl is the volume of the lung.
The volume added by the movement of the piston Pb from the zero or reference position l=0 is expressed as:
 (2)
(2)
where Sp is the area of the piston [dm2] and L denotes the position of the piston [dm].
The position of the piston Pb is controlled by its velocity v, and thus there holds
 (3)
(3)
where v is the velocity of the piston [dm/s].
To express the relationship between the volume Vt and the pressure pt in the TB, we use the ideal gas law; we then have
 (4)
(4)
where n is the amount of gas (measured in moles), R is the universal gas constant, and T is the absolute temperature of the gas. Using commonly applied units, the equation can be rewritten in the following form:
 (5)
(5)
where n is the amount of gas [mol], R is the universal gas constant [J mol-1K-1] , T is the absolute temperature [K], Vt is the volume of the TB [dm3] and pt is the pressure of the gas inside the TB [bar].
Assuming constant temperature of the air in the TB to be 20 oC, which gives T=293.15 K and R=8.31 J mol-1K-1, the gas law equation can be expressed in the form
 (6)
(6)
At the beginning of the working cycle of the LUNG simulator, we can assume atmospheric pressure in both the TB and the lung cylinder (balloon). Thus, the following equation is valid:
 (7)
(7)
where pa is the atmospheric pressure, and n0 is the initial amount of the air inside the TB.
As the TB is not tight enough, the amount of the air inside will be changed during the operation of the simulator, and we thus have . Then, using (7) and (6), we derived the final formula between the volume and the pressure inside the TB:
 (8)
(8)
where m represents the leakage of air into the TB. We assume the time rate of leakage in the form
 (9)
(9)
where is the vacuum in the TB, and C [mol s-1 bar-1] is the leakage constant.
Let us suppose Vt=Vt0 = const.; then the above formula (8) yields
 (10)
(10)
Substituting pv from (10) for m in (9) will yield
 (11)
(11)
thus, the transient response of the vacuum to the initial condition pv(0) is
 (12)
(12)
where b = 24.35 C / Vt0
Eq. (12) allows us to evaluate C by measuring the change of pressure in the TB. The initial vacuum in the TB is developed by a vacuum pump, and the transient response is measured. The results of both the measurement and the curve fitting procedure are shown in the Figure 3.
The measurement results yield C ≈ -0.07 [mol s-1 bar-1].
Mathematical model of the lung equivalent
As providing a mathematical model of a lung tissue is an extremely complicated task, we chose a rubber balloon as the lung substitute. However, even a mathematical model of the balloon can be provided only with difficulty [7]; let us therefore start with the simplest linear model of the balloon in the form of the cylinder shown in Figure 2. The following equation then represents its function in the lung simulator:
 (13)
(13)
where x is the position of the piston, B is the damping parameter, K is the stiffness of the spring, mp is the mass of the piston, and F is the force acting on the piston.
Equation (13) can be written in the more abstract form
 (14)
(14)
where ξ is the damping coefficient, and ω0 is the natural frequency. Both these coefficients characterise the dynamic properties of the balloon substitute.
The behaviour of this mathematical model obviously does not match the behaviour of a rubber balloon (and not even that of human lungs) in an exact manner; however, we can assume some average values of the dynamic coefficients ξ and ω0 and nonlinear stiffness of the spring, which will lead us to the equation
 (15)
(15)
We also assume constant atmospheric pressure inside the cylinder (balloon), and thus the force acting on the piston will be proportional to the difference of the atmospheric pressure and pressure in the TB. Taking into account the linear relationship between the position of the piston and the volume in the cylinder, we can then rewrite eq. (15) into another form:
 (16)
(16)
where
Vl …the volume of the balloon [dm^3]
ω0…the natural frequency [rad/sec]
ξ…..the damping coefficient ξ>0
pv…the vacuum [bar]
The fundamental difference between the balloon and its mechanical substitute cylinder will be diminished by an appropriate choice of the nonlinear function f(pv), which in fact represents the steady state volume of a balloon subjected to constant vacuum. Unfortunately, there is no direct measurement of Vl, and its value can thus be obtained only by flow integration, which is measured directly. We have
 (17)
(17)
where q [dm^3/sec] is the flow of air in/out of the balloon.
Furthermore, we are unable to carry out the measurement in a steady state practically. To avoid a time or phase delay between the input pv and the output Vl, we must apply a very slow change of pv. Thus, we increase the vacuum by the vacuum pump and decrease it via pure leakage of air from the TB. The measurement results are shown in Figure 4; the initial volume of the balloon is assumed to be zero.
The reasonable working region of the volume pressure characteristics is between -10 mbar and -45 mbar of vacuum, where the balloon attains a spherical shape. For the vacuum between 0 mbar and -10mbar, the balloon attains a shapeless form.
The measurement of the volume pressure characteristics shows rate-independent hysteresis. As there are no means of measuring the hysteretic behaviour in detail, we use only the average behaviour of the balloon for further modelling. Average approximation can obviously influence the design of the feedback controller because we, in fact, neglect phenomenon similar to phase or time delay. This should be borne in mind during the designing of the controller.
The following hysteresis approximations were performed:
 (18)
(18)
where p=1000pv is the vacuum in millibars.
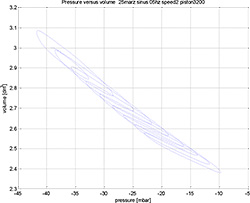
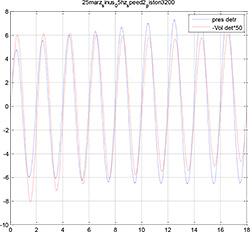
To estimate the parameters ξ and ω0, we measured several frequency responses of the system to the sinusoidal input signal of the piston velocity v . A typical response is shown in Figure 5.
The sinusoidal velocity of the piston v corresponds to the sinusoidal position of the piston l and to the sinusoidal input volume Vi. The flow and vacuum in the TB are changed not only due to the sinusoidal input signal but also due to the leakage, which begins the trend of output signals. The graph in Figure 6 presents the relationship between the pressure and the volume reveals a “hysteresis” caused by both the rate-independent hysteresis and the pure phase lag between the signals in the dynamic system of the balloon (16). To evaluate this phase lag, we must remove the trend induced by the leakage.
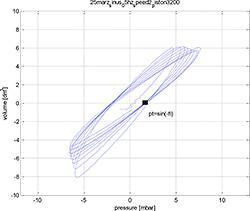
When we remove the influence of the leakage on the pressure and flow by detrending these output signals, we obtain the graphs of the volume and pressure displayed in Figures 7 and 8.
The graph in Figure 8 enables us to evaluate the phase lag between the pressure (input) and the volume (output). We know that the input signal is and the output signal corresponds to Vl = V sin(ωt + φ(ω)). Thus, for Vl = 0 we have ωt + φ = 0 and pt = P sin(-φ).
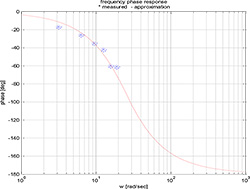
In the figure, this point is denoted by the black square. Now we perform the same procedure for several frequencies of the input signal v; the results are shown in Figure 9 and Table 1.
Table 1. The results of the phase shift measurement
|
ω [rad/sec] |
P [mbar] |
pt [mbar] |
φ [deg] |
|
3.14 |
6.12 |
1.8 |
17 |
|
6.28 |
6.21 |
2.7 |
26 |
|
9.42 |
6.29 |
3.6 |
35 |
|
12.57 |
7.00 |
4.7 |
42 |
|
15.71 |
7.53 |
6.5 |
60 |
|
18.85 |
8.01 |
7.0 |
61 |
All the measurements were performed with the same piston position amplitude, and we thus obtained several points of the Bode plot phase of the system.
Comparing the phase plot from Figure 9 with the phase plot of the 2nd order system (16), we obtain ξ≈0.8 and ω0≈25 rad/sec, which yields the settling time of the system’s step response in the form ts≈.5sec.
Mathematical model of the vacuum pump
In the final section of the paper, we propose a model of the vacuum pump of the lung simulator. The pump is designed to compensate any leakage of air into the TB; it sucks the air out of the TB, thus increasing the vacuum inside. The mechanism is controlled by an on-off switch and reaches a 10mbar drop of pressure in approximately 3 secs when on. The pump is used during the starting period to provide the initial vacuum of <-40;-30> mbar, it is switched on irregularly to keep the vacuum inside the TB within the prescribed limits. During the feedback control of the flow or volume of the lung, we can consider the action of the pump as a disturbance which must be suppressed by the flow or volume controller. Thus, our model of the pump activity can be rough; we propose a simple model in the form:
 when on (19)
and
 when off (20)
This completes the mathematical model of the lung simulator with a balloon. The simulation scheme of the model is shown in Figure 10.
At this point, let us recapitulate some parameters and important data of the model:
Vt… the volume of the thoracic box (max. 40dm3);
Vt0…the initial volume of the TB (when the Pb is in the zero position): 30dm^3;
Vi… the volume added by the movement of the piston Pb (max 5dm^3) ;
Vl… the volume of the lung (max 3dm^3) ;
Sp…the area of the piston (2.7dm2) ;
pv…the vacuum inside the thoracic box (max - 50mbar).
Comparison of the complete mathematical model with the real operation of the lung simulator
Let us now compare selected results of the simulation and measurement with the real system. The simulation is performed with the same LUNG simulator parameters as mentioned above.
1st experiment
The real experiment is performed with the input piston velocity of a square form. The piston position amplitude l is Al = 0.12dm, and the amplitude of the input volume is Vi = 0.324dm3.
The amplitude AVl of the balloon volume is approximately 0.25dm3.
The piston velocity amplitude is 1 rps, which corresponds to v=0.2 dm/sec; this yields the input signal period of T=4*Al/v=4*0.12/0.2=2.4 sec.
The amplitude of the “input flow” is Aif=vSp=0.2*2.7=0.54dm3/sec=32.4dm3/min.
See also Figure 11.
2nd experiment
The real experiment is performed with the input piston velocity of a sinusoidal form. The piston position amplitude corresponds to l Al = 0.12dm, and the input volume amplitude is Vi =0.12*Sp=0.12*2.7=0.324dm3.
The amplitude AVl of the balloon volume is approximately 0.25dm3 .
The piston oscillation frequency is f=0.5Hz or ω = 2πf = 2π0.5=πrad/sec, which corresponds to the oscillation period of T=1/.5=2sec. The piston velocity amplitude is Avl=Alω=0.12π=0.37dm/s
The amplitude of the “input flow” is Aif=AvlSp=0.37*2.7=1dm3/sec=60dm3/min.
When comparing the behaviour of the mathematical model with that of the real system, we must remember that the model is constructed for vacuum higher than -20mbar.
General agreement can be observed between the simulation behaviour and the reality for this range of the vacuum. The main discrepancies between the mathematical model and the real system can be identified in amplitudes of the variables, the flow of air in and out of the balloon in particular. This can be explained by the rather rough evaluation of the compliance of the balloon and also by the rather rough modelling of the bellows used in the LUNG simulator. Above all, then, the flow amplitude is rather sensitive to the parameter Sp (the piston area). A smaller piston area provides lower values of flow.
Conclusion
The lung simulator described and analysed in this article was one of the main goals of the research project AlveoPic – Advanced Lung Research for Veterinary Medicine of Particles for Inhalation. We expect to apply the simulator also in the “double degree study programme”, which was a part of AlveoPic too. The lung simulator is original especially in the usage of real lungs or their substitution in the form of a balloon of various shapes and materials.
Experiments with the real lung simulator proved the basic theoretical ideas and revealed some deficiencies in the mechanical structure of the simulator. The main imperfection was identified in the leakage of the thoracic box; this problem was nevertheless eliminated through the use of the vacuum pump and its relatively simple on-off feedback control. The control of the lung air flow and the pressure in the thoracic box via the vacuum pump proved to be robust enough for the simulator to reproduce various types of breathing. Very good results were obtained during the simulation of “harmonic breathing“, namely a process where the air flow from and to the lungs is a harmonic function of time. Good results were also obtained in simulating the physiological breathing curve. Some experiments not mentioned in this article were carried out with porcine lungs, and these also pointed to the fully satisfactory functioning of the simulator. We suppose that the simulator can be used both for pedagogical as well as research goals.
Acknowledgement
This work was supported by “Advanced lung research for veterinary medicine of particles for inhalation – cooperation” (Alveopic), OPPS AT-ČR M00250.

References
1. Eschli AA. Development of a mathematical model to simulate the breathing control of the i-lung 2 and verification of the model by testing it at the real system. Bachelor thesis , Fachhochschule Technikum Wien, Vienna, March 2014.
2. David V, Forjan M, Steiner T, Bures Z, Drauschke A. Mechanical and Electrical Specification of the Active Lung Simulator i-Lung – Development if i-Lung 1.0 to i-Lung 2.0, Proceedings of 12th IFAC/IEEE International Conference PDES 2013, Velke Karlovice, Czech Republic: 13-23
3. Zezulka F, Drauschke A, Bures Z, Krejci I, Balcar J, Prochazka M. Physical Lung Simulator For Ex VIVO Measuring of Aerosol Deposition in Lungs. Journal of the Technical University – Sofia Plovdiv branch 2013; 19: 323-327.
4. Ionescu CM, Machado JAT, De Keyser R. Modeling of the lung impedance using a fractional-order ladder network with constant phase elements. IEEE Trans Biomed Circuits Syst 2011; 5(1):83-89.
5. Mesić S, Babuska R, Hoogsteden HC, Verbraak AFM. Computer-controlled mechanical simulation of the artificially ventilated human respiratory system. IEEE Trans Biomed Eng 2003; 50(6): 731-743.
6. Tang R, Ge B, Yan R, Liang H. Researches on artificial lung simulators. International Conference on Future BioMedical Information Engineering 2009: 30-32.
7. Muller I., Struchtrup H. Inflating a Rubber Balloon. Math Mech Solids 2001; 7: 569-577.
Please cite as:
Šolc F, Zezulka F, Veselý I, Sekora J, Mézl M, Eschli A, Provazník I. The mathematical model of a LUNG simulator. MEFANET Journal 2014; 2(2): 71-78. Available at WWW: http://mj.mefanet.cz/mj-04141203.
This is an open-access article distributed under the terms of the Creative Commons Attribution-NonCommercial-ShareAlike 3.0 License (http://creativecommons.org/licenses/by-nc-sa/3.0/), which permits unrestricted use, distribution, and reproduction in any medium, provided the original work, first published in the MEFANET Journal, is properly cited. The complete bibliographic information, a link to the original publication on http://www.mj.mefanet.cz/, as well as this copyright and license information must be included.
![Figure 1. The electromechanical structure of the LUNG simulator [1] Figure 1. The electromechanical structure of the LUNG simulator [1]](/res/image/vol2-iss2/04141203-fig01-thumb.jpg)
